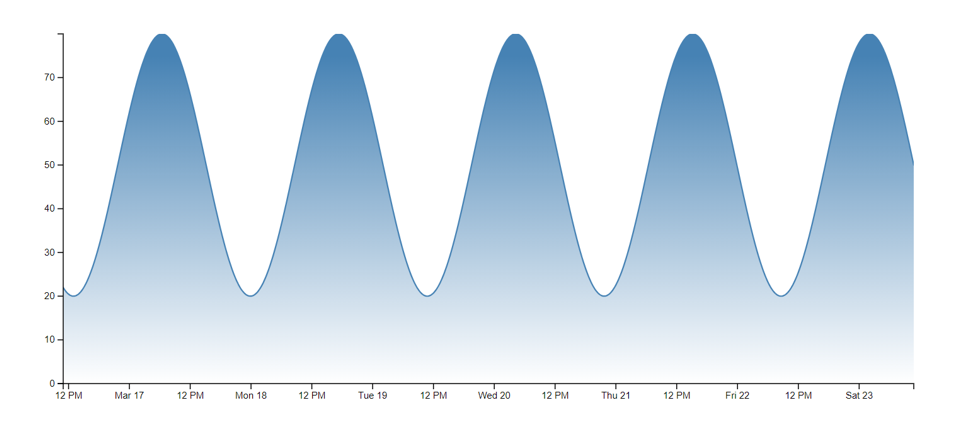
D3.js Zoomable Line Chart
A simple line graph that allows for zooming, updated to version 7 of d3.js. The maintainers really need to update the examples for their site as they are stuck on version 4.
I am still not convinced d3.js is focused on making charts. It seems more of a library for making SVG graphics.

Everything is all in one HTML page, so you can view the source to see what is going on. I have been working with D3.js a bit the past few weeks and wanted to leave myself this note for future reference.
A few notes with how to work it:
- drag with mouse to zoom into selected area
- When you are zoomed in, you can drag the mouse to pan
- When you are zoomed in, you can double click to zoom back out
Page Contents

Hi, I'm Scott
I mostly keep this blog to help me remember things. Writing is also a great way to understand things at a deeper level. I would highly recommend it if you don't write at all.